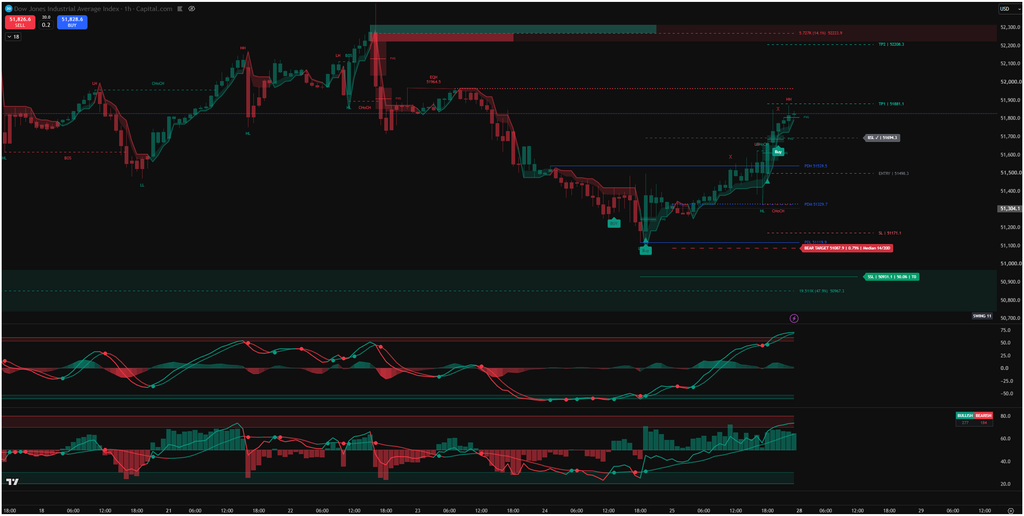
US30 has recovered strongly from the recent low near 51,100 and is now trading around 51,827 on the H1 chart. The short-term structure has turned upward, but price is approaching an area where the next reaction matters.
Levels to watch
- 51,881: the nearby high. A confirmed H1 close above it would support further upside.
- 51,964: the next marked high and a possible area of resistance.
- 52,208–52,223: an overhead zone where we would watch for a reaction.
- 52,440–52,571: the higher zone, with buy-side liquidity (BSL) marked near 52,571.
- 51,694 and 51,498: nearby levels to monitor if the current rise loses momentum.
Our scenario
The bullish scenario remains favourable if US30 breaks and holds above 51,881 on a closed H1 candle. That would bring 51,964 into focus, followed by the 52,208–52,223 zone. We would then reassess whether price has enough strength to reach the higher BSL area.
A brief move above the high followed by an H1 close back below it would change the picture. That would suggest a possible liquidity sweep rather than a confirmed breakout. In that case, we would watch the reaction around 51,694 and then 51,498 before considering any new direction.
The chart also marks sell-side liquidity (SSL) much lower, near 50,931. This is a reference for a broader bearish scenario, not an immediate target implied by the current H1 move.
The key is confirmation: let the H1 candle close, observe how price reacts at the level, and only then evaluate whether the setup is still valid.
SSM Markets — Follow the liquidity. Trade with confirmation.
Chart-based analysis, not a guarantee of future price movement.
SSM Markets — Probability over prediction.
