S&P 500 H1: Price Tests Buy-Side Liquidity — Can the Recovery Continue?
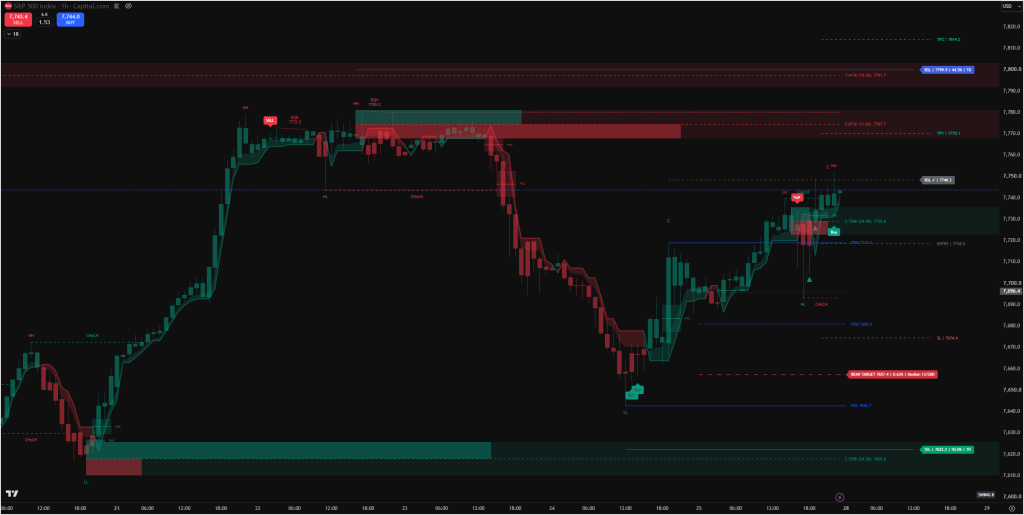
On the H1 chart, the S&P 500 has recovered from the low near 7,643 and formed a short-term upward structure. Price is around 7,743, close to the buy-side liquidity (BSL) marked at 7,748. Its reaction at this level could shape the next move. Bullish scenario The bullish setup becomes more favourable if an H1 candle […]
S&P 500 H1: Price Tests Buy-Side Liquidity — Can the Recovery Continue? Read More »