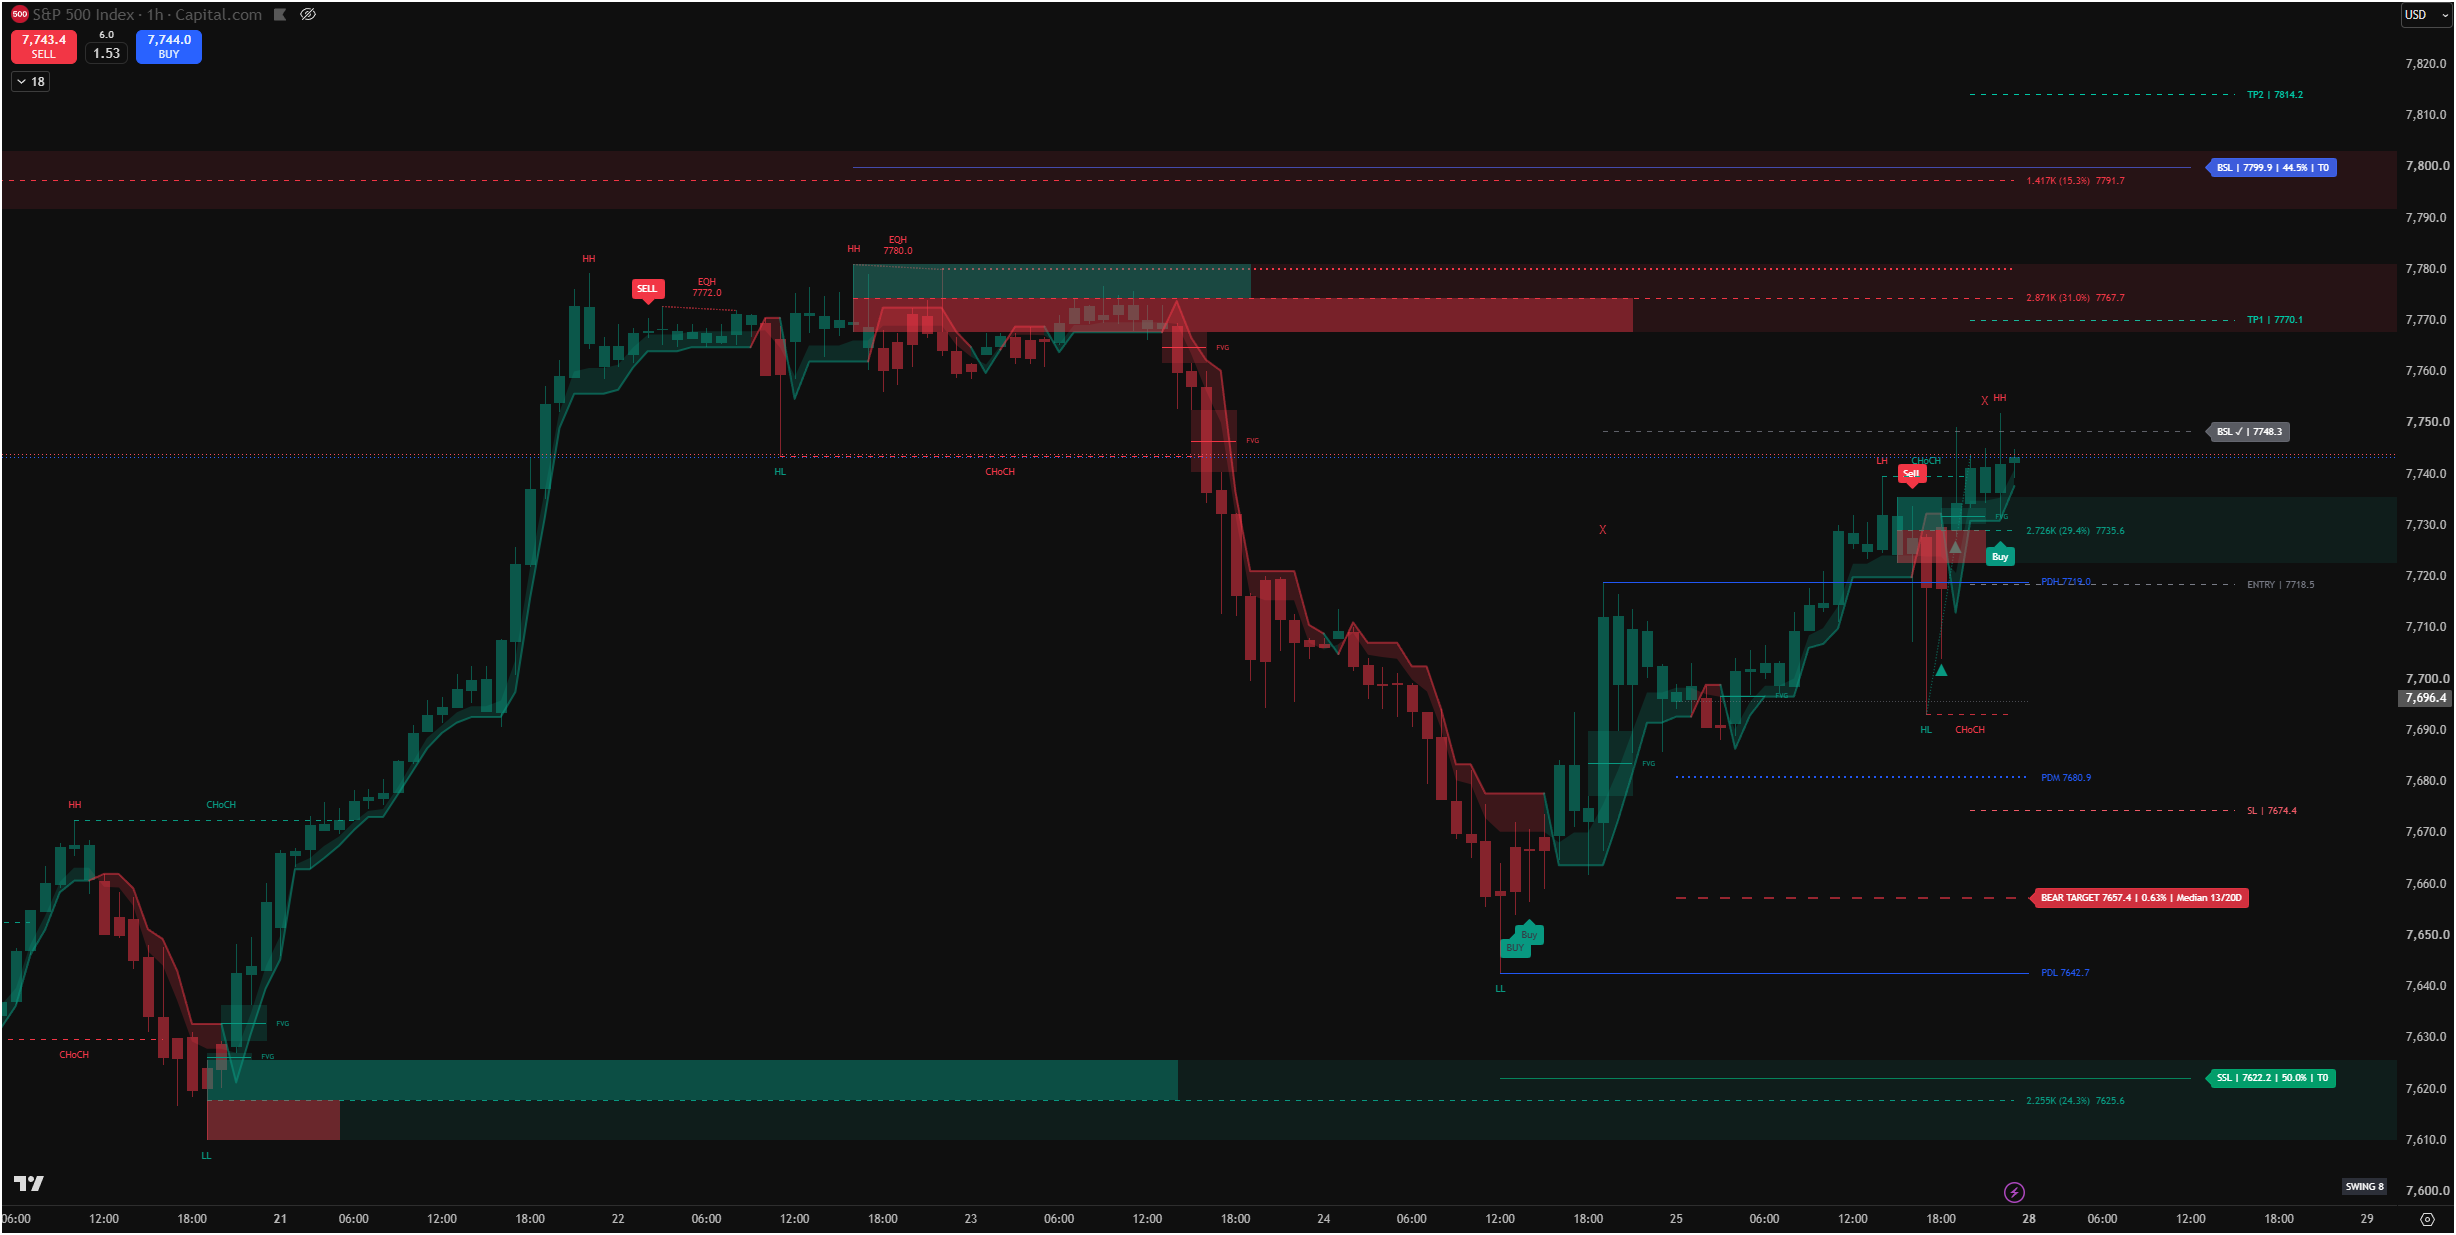
On the H1 chart, the S&P 500 has recovered from the low near 7,643 and formed a short-term upward structure. Price is around 7,743, close to the buy-side liquidity (BSL) marked at 7,748. Its reaction at this level could shape the next move.
Bullish scenario
The bullish setup becomes more favourable if an H1 candle closes above 7,748 and price holds above that level. We would then watch 7,768–7,780, an overhead supply zone that also contains previous equal highs (EQH).
If price clears that zone with confirmation, the next level to watch is the BSL near 7,800. The supply zone could still cause a rejection, so the reaction there matters.
Rejection scenario
If price briefly moves above 7,748 but the H1 candle closes back below it, the move may be a liquidity sweep rather than a confirmed breakout. In that case, we would watch support at 7,726–7,736, followed by 7,719.
A break below 7,719 would weaken the recovery. Below that, 7,681 and 7,674 become reference levels for a broader bearish scenario. Sell-side liquidity (SSL) is marked at 7,622, but it is not an immediate target while the local upward structure remains intact.
Conclusion: the short-term direction is upward. To confirm continuation, we want to see an H1 close above 7,748, followed by a sustained move and a clear reaction at 7,768–7,780.
SSM Markets — Probability over prediction.
These levels describe conditional scenarios, not guaranteed outcomes.
